|
|
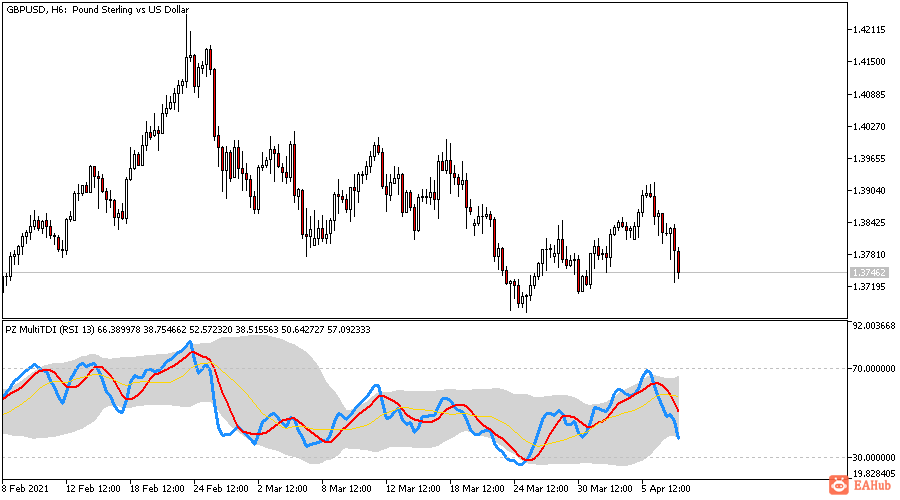
This indicator is a personal implementation of the famous Traders Dynamic Index, which uses RSI, moving averages and volatility bands to find trends, reversals and price exhaustions. However, this particular implementation supports not only RSI, but also many other indicators. It is suitable for scalping, day trading, and swing trading and aims to provide a full picture of the current market conditions.It is a complex but very useful indicatorSupports RSI, CCI, Stoch, AO, AC, Momentum, WPR, Demarker, RVI, ATR, ROC and ROC of RSIAlerts on oversold/overbought levelsAlerts on trend reversals
The components of the indicator are the following:The blue line is the main lineThe red line is the signal lineThe yellow line is the trend lineThe bands are relative oversold and overbought levelsThe oscillatorlevels are absolute oversold and overbought levels
For position tradingLong if the blue line falls below the lower bandShort if the blue line shoots above the upper bandConfirm optional with the native oversold/overbought levels of the oscillator used
For scalpingLong if the blue line crosses the red line upwards, after leaving the deviation bandsShort if the blue line crosses the red line downwards, after leaving the deviation bands
For day tradingLong if the blue line crosses the red line upwards and is above the yellow lineShort if the blue line crosses the red line downwards and it below the yellow line
For swing tradingLong if the blue is above both red and yellow lines, however only if all the lines are below the 50 level.Short if the blue line is below both red and yellow lines, however only if all the lines are above the 50 level.
Optionally, you can use higher timeframes to discard or confirm trades and get better timing.
 |
|



 发表于 2026-8-21 20:00:00
