|
|
我们在开发自定义指标的时候,有时候需要开发彩带指标,如下图所示。彩带可能需要显示在附图,也可能需要显示的主图。
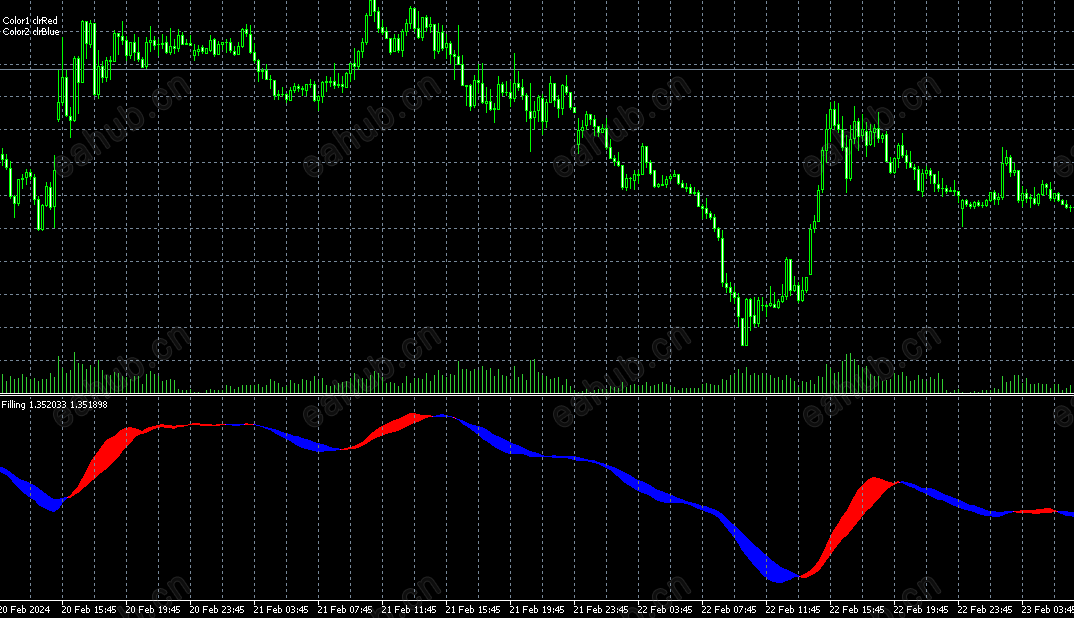
这样的需求,在MT5中是非常容易实现的,只要设置指标类型为DRAW_FILLING 即可。
#property indicator_type1 DRAW_FILLING 复制代码
上图代码如下
#property copyright "EACODE"
#property link "http://www.eacode.cn"
#property description "An indicator to demonstrate DRAW_FILLING"
#property description "It draws a channel between two MAs in a separate window"
#property description "The fill color is changed randomly"
#property description "after every N ticks"
#property indicator_separate_window
#property indicator_buffers 2
#property indicator_plots 1
//--- 标图交集
#property indicator_label1 "Intersection"
#property indicator_type1 DRAW_FILLING
#property indicator_color1 clrRed,clrBlue
#property indicator_width1 1
//--- 输入参数
input int Fast=13; // 快速MA的周期
input int Slow=21; // 慢速MA的周期
input int shift=1; // 向未来的MAs转移(正值)
input int N=5; // 改变订单号数量
//--- 指标缓冲区
double IntersectionBuffer1[];
double IntersectionBuffer2[];
int fast_handle;
int slow_handle;
//--- 存储颜色的数组0到5的
color colors[]={clrRed,clrBlue,clrGreen,clrAquamarine,clrBlanchedAlmond,clrBrown,clrCoral,clrDarkSlateGray};
//+------------------------------------------------------------------+
//| 自定义指标初始化函数 |
//+------------------------------------------------------------------+
int OnInit()
{
//--- 指标缓冲区映射
SetIndexBuffer(0,IntersectionBuffer1,INDICATOR_DATA);
SetIndexBuffer(1,IntersectionBuffer2,INDICATOR_DATA);
//---
//PlotIndexSetInteger(0,PLOT_SHIFT,shift);
//---
fast_handle=iMA(_Symbol,_Period,Fast,0,MODE_SMA,PRICE_CLOSE);
slow_handle=iMA(_Symbol,_Period,Slow,0,MODE_SMA,PRICE_CLOSE);
//---
return(INIT_SUCCEEDED);
}
//+------------------------------------------------------------------+
//| 自定义指标迭代函数 |
//+------------------------------------------------------------------+
int OnCalculate(const int rates_total,
const int prev_calculated,
const datetime &time[],
const double &open[],
const double &high[],
const double &low[],
const double &close[],
const long &tick_volume[],
const long &volume[],
const int &spread[])
{
static int ticks=0;
//--- 计算订单号改变样式,颜色和线型宽度
ticks++;
//--- 如果足够数量的订单号被积累
if(ticks>=N)
{
//--- 改变线型属性
ChangeLineAppearance();
//--- 重置0计数器
ticks=0;
}
//--- 指标的第一次计算,或数据变化,需要一次完全重新计算
if(prev_calculated==0)
{
//--- 复制所有指标值至相应的缓冲区
int copied1=CopyBuffer(fast_handle,0,0,rates_total,IntersectionBuffer1);
int copied2=CopyBuffer(slow_handle,0,0,rates_total,IntersectionBuffer2);
}
else // 仅填充那些更新的数据
{
//--- 获得OnCalculate()当前和之前启动之间的柱形不同
int to_copy=rates_total-prev_calculated;
//--- 如果没有不同,我们仍然会复制一个值 - 在零柱
if(to_copy==0) to_copy=1;
//--- 复制_copy 值到指标缓冲区的最末端
int copied1=CopyBuffer(fast_handle,0,0,to_copy,IntersectionBuffer1);
int copied2=CopyBuffer(slow_handle,0,0,to_copy,IntersectionBuffer2);
}
//--- 返回 prev_calculated值以便下次调用函数
return(rates_total);
}
//+------------------------------------------------------------------+
//| 改变通道填充颜色 |
//+------------------------------------------------------------------+
void ChangeLineAppearance()
{
//--- 形成线型属性信息的字符串
string comm="";
//--- 改变线型颜色的模块
int number=MathRand(); // 获得随机数
//--- 除数等于colors[]数组的大小
int size=ArraySize(colors);
//--- 获得选择新颜色作为整数除法余数的标引
int color_index1=number%size;
//--- 设置第一个颜色为PLOT_LINE_COLOR 属性
PlotIndexSetInteger(0,PLOT_LINE_COLOR,0,colors[color_index1]);
//--- 写下第一个颜色
comm=comm+"\r\nColor1 "+(string)colors[color_index1];
//--- 获得选择新颜色作为整数除法余数的标引
number=MathRand(); // 获得随机数
int color_index2=number%size;
//--- 设置第二个颜色为PLOT_LINE_COLOR 属性
PlotIndexSetInteger(0,PLOT_LINE_COLOR,1,colors[color_index2]);
//---写下第二个颜色
comm=comm+"\r\nColor2 "+(string)colors[color_index2];
//--- 使用注释在图表上显示信息
Comment(comm);
}复制代码
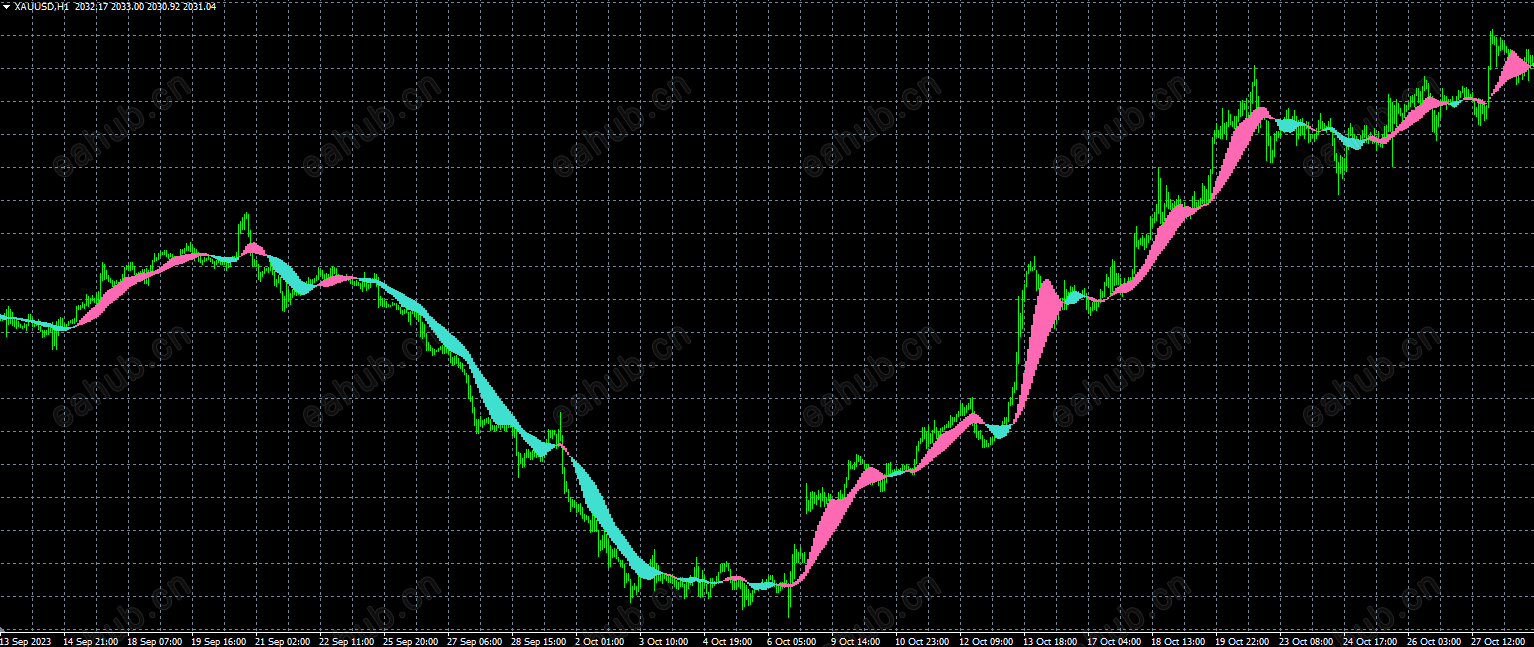
在MT4中由于不支持DRAW_FILLING指标类型,我们可以通过DRAW_HISTOGRAM来实现。
只需要在主图,定义两个DRAW_HISTOGRAM类型的Buffer,就可以实现该功能。
#property indicator_chart_window
#property indicator_buffers 2
#property indicator_plots 2
//--- 标图交集
#property indicator_label1 "均线带"
#property indicator_type1 DRAW_HISTOGRAM
#property indicator_color1 clrRed
#property indicator_width1 3
#property indicator_label2 "均线带"
#property indicator_type2 DRAW_HISTOGRAM
#property indicator_color2 clrLime
#property indicator_width2 3复制代码
最终效果如下。
完整代码如下:
购买
已有0人购买, 当前内容需向作者支付 3 H币 才能浏览 |
|



 发表于 2026-8-26 07:45:00
